 Housing finance in Africa: Recovery through recognition of massive small potential
This blog was originally published in December 2021, here: https://housingfinanceafrica.org/documents/housing-finance-in-africa-recovery-through-recognition-of-massive-small-potential
This blog originally appeared as the introductory essay[1] to the 2021 edition of the Housing Finance in Africa Yearbook.
After a difficult year, African housing markets are showing their resilience, responding to the challenges with innovation and perseverance that earlier years might not have imagined. Housing circumstances across the continent continue to be dire – living conditions have worsened in many areas, and with businesses closing and governments stretched beyond capacity, the need seems insurmountable. However, as the world emerges, albeit slowly, from the intensity of the global pandemic, niche market interventions are offering opportunities for optimism and engagement, and hopefully for some investment too.
Among the myriad of ways in which the pandemic impacted on the lives of households and the affairs of businesses and governments, it magnified the housing crisis, and its concomitant opportunities, at a very local level. Households’ experiences with their own housing have been at the core of how they managed the impact of the pandemic on their lives, whether in the intensity of living in lockdown or in their inability to adhere to the COVID-19 protocols advocated by health officials, given their poor access to water and sanitation services and cramped conditions. As the continent suffered the worst economic recession in half a century[2], the ability of governments to respond has been severely constrained. Disastrous, this has also created a sense of pragmatism among the players, in both the public and private sectors, as well as among households themselves.
The experience has been sobering, and it is this clarity that we must harness as we look forward into the next few years. While analysts talk of a ‘bounce back’ citing the potential of tourism and commodities (graciously strong as the global economy again opens up), lessons learned about the reality of affordability and niche efforts of supply are arguably equally as important in supporting ambitions for economic growth. Housing is a quintessentially local economic activity – and given its impact not only on living conditions, but also on household balance sheets and the sustainability of human settlements – it should be (and in many cases is), a central strategy of government, with the active participation of all departments, from land and housing, through to trade and industry, and finance.
This year, there are more examples of houses priced at the bottom of what was considered possible. While many of these are likely to reflect some level of subsidisation, this too reflects a growing appreciation of the reality of affordability and the very real effort needed to make quality housing accessible to the majority. This attention to affordability and access is also being witnessed in the finance space, with more examples of non-mortgage housing microfinance products. We have also seen important movement (and therefore clarity) in the policy space, with at least sixteen countries passing legislation in support of local land and housing markets.
Meanwhile, households continue to be the primary supplier of their own affordable housing – building their homes themselves, primarily with savings, step by step, incrementally realizing their goal for adequate housing. As we gather the lessons of the past two years, this one must stand out: crises come and crises go, but people must still find somewhere decent to live. Developing appropriate policies, products and services that support and further leverage this energy must be the focus as we emerge out the pandemic, as all players grapple with the impossible imperative of having to do so much more with so much less.
A difficult year
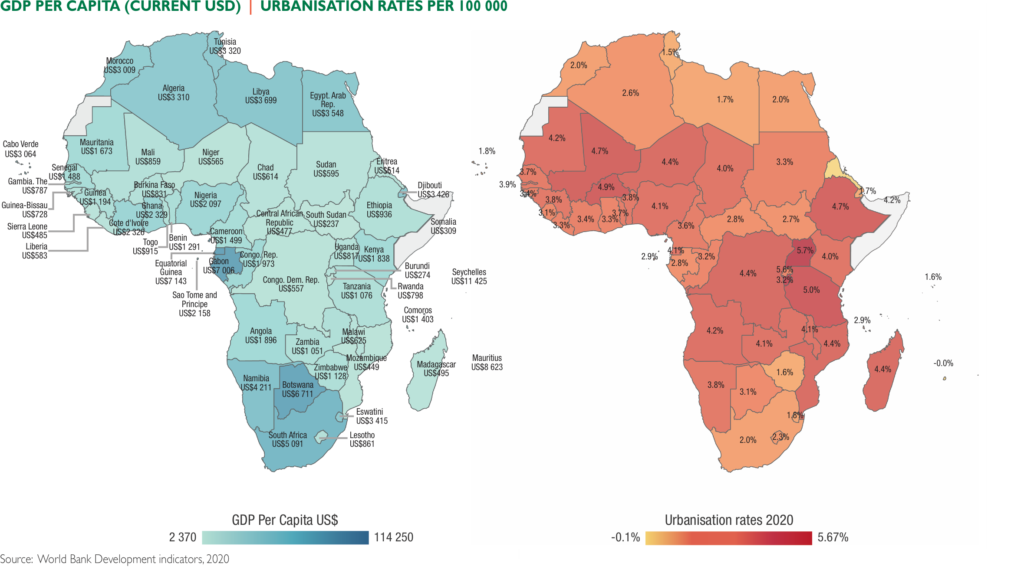
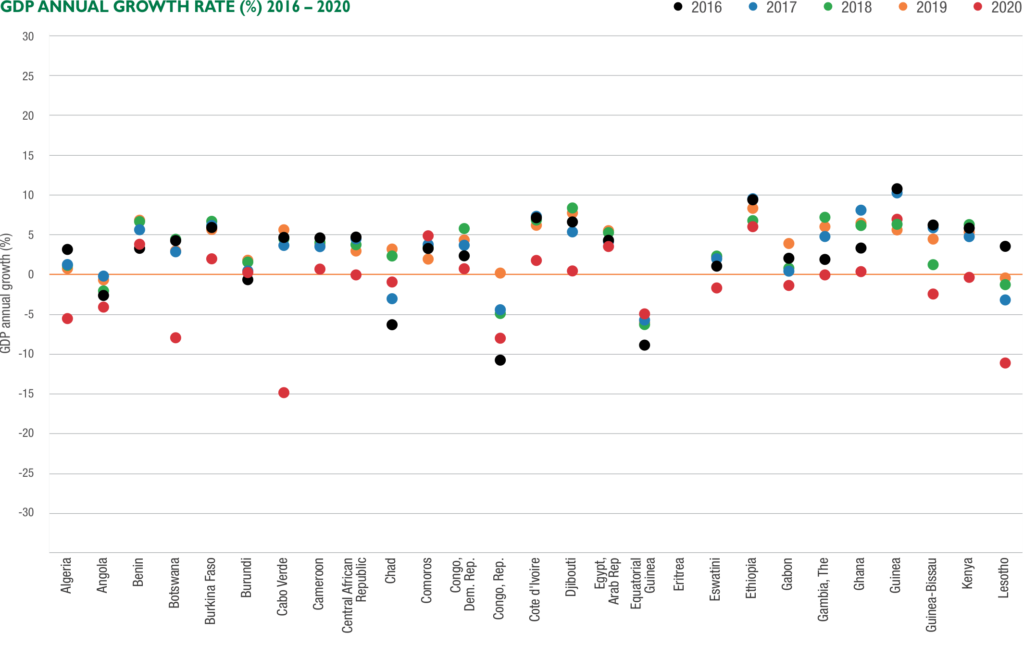
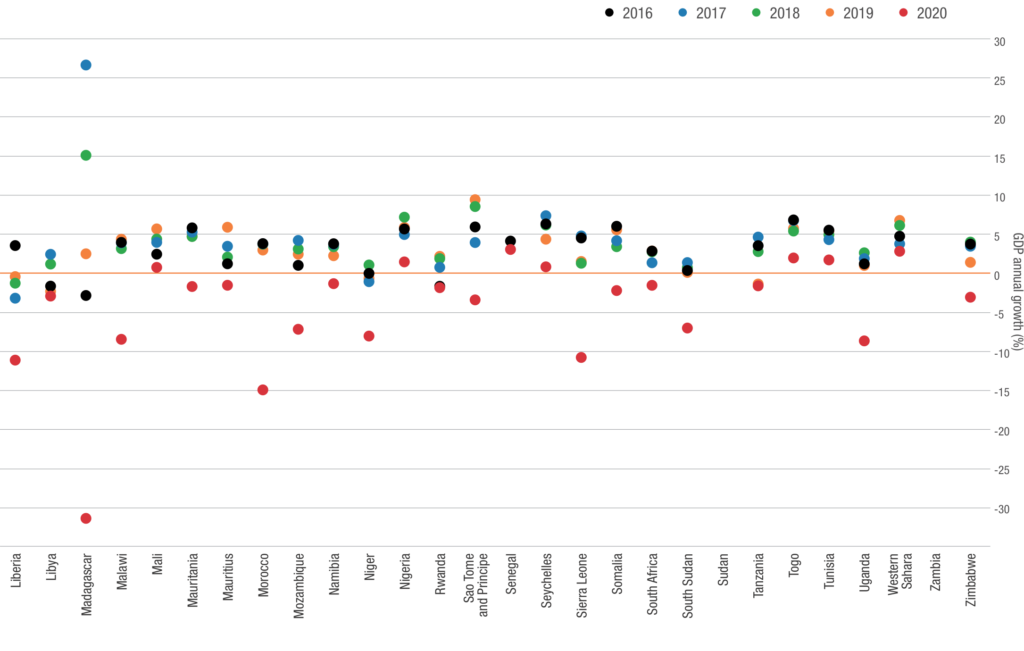
The African Development Bank has named 2020 the worst economic year in the last fifty in Africa. Largely as a result of the pandemic, real GDP on the continent contracted by 2.1% in 2020, with more than half of all countries on the continent suffering negative GDP growth rates, many in excess of -5% (Madagascar fared the worst with a GDP growth rate of -32%). GDP per capita is particularly low throughout East, Central, and West Africa. Calculating the number of people living on less than US$1.90 a day, the AfDB estimates that about 30 million Africans fell into extreme poverty in 2020. Worst-case estimates suggest that in 2021, 34.4% of Africans could be in extreme poverty, versus pre-COVID estimates of about 31.5% – an increase of about 38.7 million people.[3]
While much of the continent remains rural, urbanisation rates in excess of 2% per annum are changing this picture in very many countries. Highest in East, Central and West Africa, Uganda’s urbanisation rate beats all others, at 5.7%. This has a particular impact on cities. For example, the urbanisation rate in the DRC, estimated at 4.1%, is equivalent to adding one million city dwellers each year – that would be 2 739 people per day, or 114 people per hour, or almost two people walking into the cities of the Democratic Republic of the Congo per minute. The World Bank estimates that at that rate, the DRC’s urban population will double in 15 years. This, in a country where 73% of the population (about 60 million people) live on less than US$1.90 per day.[4] How are city managers to accommodate such an influx?
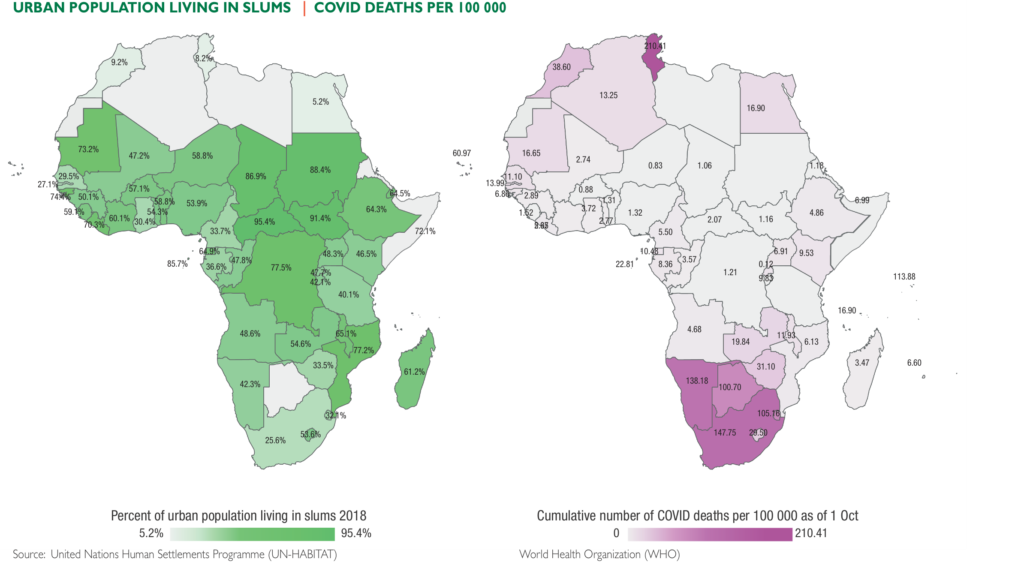
In part because of this, substantial proportions of urban populations continue to live in slums (the DRC’s housing backlog is estimated at almost four million units[5]). While the data is not frequently updated, it is worth considering the impact of inadequate housing on household resilience to the pandemic and other emergencies. In 2018, UN Habitat reported on SDG indicator 11.1, the percentage of the urban population living in slums. In only twenty countries was the percentage less than half the urban population; in seven countries it was more than three quarters. Linked to poverty as well as to broader macro-economic factors, the percentages of urban populations living in slums is particularly high in East, Central and West Africa.
Meanwhile, the direct impact of the pandemic is measured in the number of COVID-19 related deaths per 100 000 people. This is an official figure, collected by local health offices in each country. Indicative, it does not include the total number of excess deaths, which are understood to be much higher.[6] Per 100 000, excess deaths have been reported as 369 in South Africa and 186 in Egypt.[7]
On top of this, the effects of climate change have been significant, with floods and landslides in many of the island countries (Seychelles, Comoros, and Madagascar) as well as in Djibouti, Chad and Sierra Leone, cyclones on the east coast of the continent, and desertification and drought in drier countries, including Sudan and Cabo Verde. Communities living in informal settlements and on low-lying or steep terrain have been particularly impacted, especially this year in Congo, Guinea Bissau, Togo, Sierra Leone, Djibouti and the Gambia.
All of this has a particular impact on the state. While national lockdowns meant that revenue potential declined dramatically, demands on the fiscus increased in even greater measure. The AfDB estimates that as a result of the pandemic, African governments required an additional US$125-US$154 billion in gross financing – this, on top of the impossible-to-meet requirements they had before COVID-19. This has substantially increased the average debt-to-GDP ratio across the continent, pushing it over 70%, an increase of over ten percentage points since 2019.[8]
There is nuance in these figures. Earlier this year, CAHF launched a dashboard exploring the housing circumstances of the bottom 40th percentile.[9] Drawing on data from the Demographic and Health Surveys database of surveys undertaken globally by USAID[10], the dashboard compares household characteristics, dwelling characteristics, access to services, housing inadequacy and other factors among the bottom 40th percentile of households in ten African countries. The dashboard allows for the data to be explored by geography: national, urban areas, largest city; by wealth segments: bottom 40th percentile, middle 40th percentile, and upper 20th percentile; and by housing situation. The overwhelming conclusion of the data is that while housing needs are clearly high, especially among the bottom 40th percentile, they are not absolute. That is: households living in what might be classified as slum housing may not in all instances require a new house in its entirety – rather they may simply require investment in home improvements – in situ upgrading of water and sanitation, the construction of an additional room, the replacement of a roof, and so on.
For example, 2019 DHS data for Senegal suggests that 52% of urban dwellings are inadequate. Of these, the majority (95%) are constructed from formal material building materials. The primary inadequacy is in terms of sanitation; 38% of households live in housing where sanitation is unimproved or shared with other households. A further inadequacy relates to overcrowding: 29% of Senegalese households living in urban areas occupy dwellings in which there are three or more people per sleeping room. These inadequacies are greatest for households in the bottom 40th percentile: 73% of households live in dwellings with one or more inadequacy. However, they also exist for the middle 40th percentile, as 54% of households in that segment live in dwellings with one or more inadequacy. While there is nuance in the housing inadequacy, therefore, there is also nuance in the capacity of households to deal with that inadequacy and finance their own home improvements.
The ultimate housing-related consequence of these factors is not entirely clear: across the continent, many people have been living in inadequate circumstances for a long time. Although the pandemic exacerbated the housing challenges that households face, it did not introduce them.
Building affordably
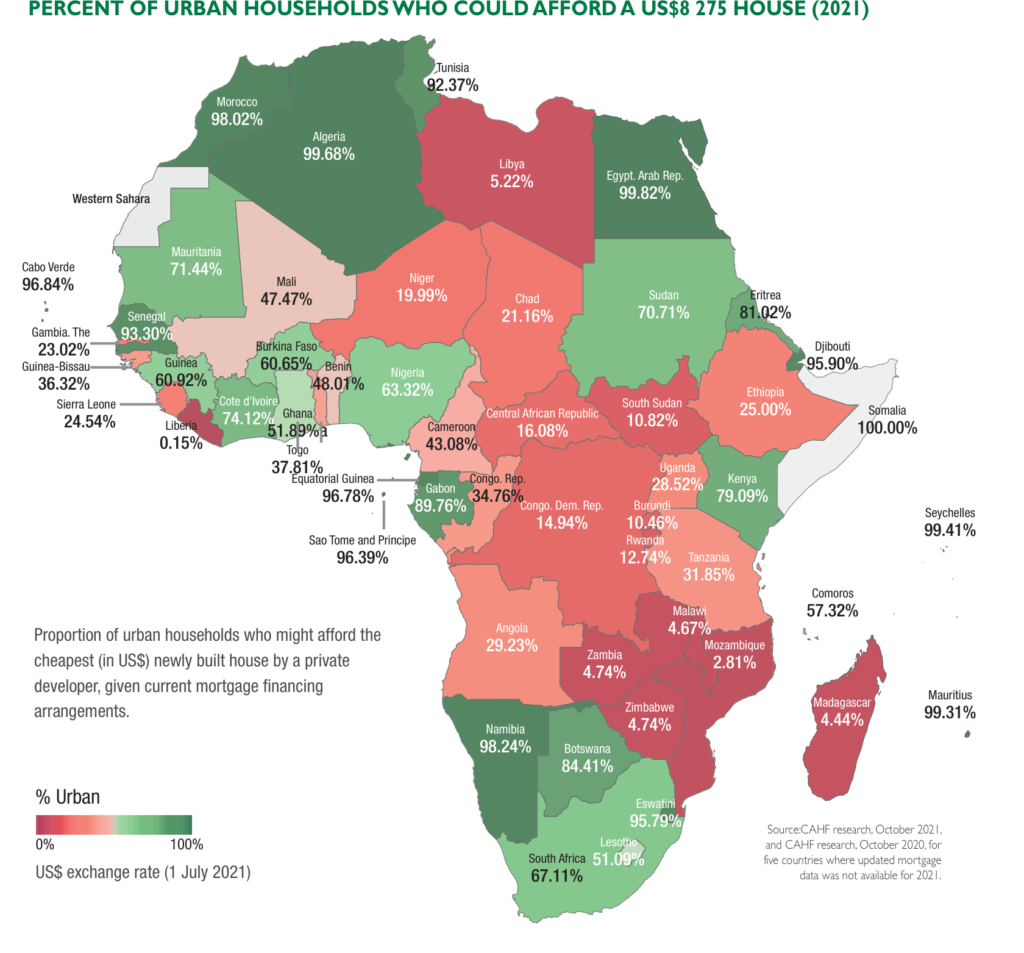
Every year, CAHF invites the authors of the Yearbook country profiles to identify the cheapest newly built house by a formal developer or contractor in an urban area, documenting the price in local currency units. Yearbook authors survey three formal developers who are known for delivering to the affordable market in the main urban centre of the country and request the sales price of the cheapest newly built house available on the market in the current year. The authors then select the lowest price house from these three examples.
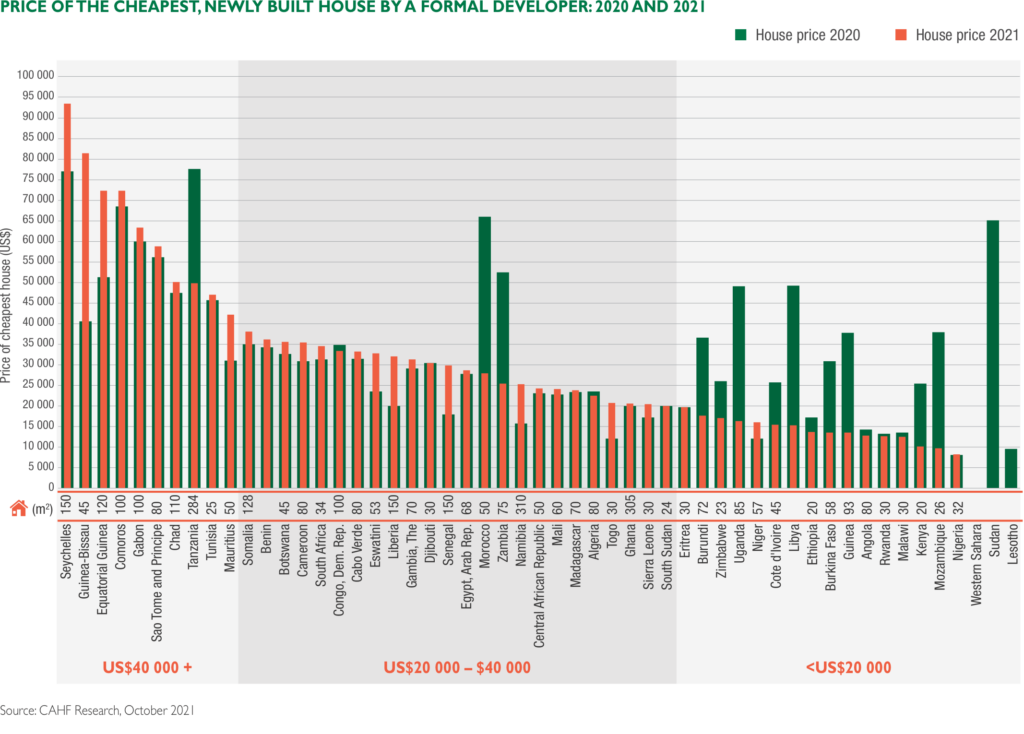
Focused on private developers, the data does not speak to what can be built, but rather, what is being built, reflecting market targeting rather than market capacity. In many countries, the cheapest newly built house is still above US$40 000. In most countries however, the cheapest newly built house falls between US$20 000 and US$40 000. In many instances, the price of the housing is not directly linked to its size – price per square metre for a 30m2 unit ranges (in this very rudimentary calculation) from US$415 in Malawi through to US$1 012 in Djibouti; an 80m2 unit in Angola is US$159/m2 while in Sao Tome and Principe, 80m2 is delivered at US$735/m2.
The cost of housing is the sum of several factors, not just the cost of construction itself. In CAHF’s ongoing review of the estimated cost to build a ‘typical’ 55m2 house, construction costs (building materials and labour) consistently comprise about 45% of the total (48% in Côte d’Ivoire and 42% in South Africa). Infrastructure costs comprise about 14% (5% in Nigeria, 14% in both Kenya and Ghana, 15% in Côte d’Ivoire). Across the continent as well as in these countries, the cost of infrastructure is often borne by the development itself, fully recouped through the cost of the units, rather than undertaken by the municipality and then amortized over a longer period so that it is reflected in the land price. This has to do with the infrastructure investment capacity of the municipal government. Nevertheless, in Kenya and Uganda, the cost of land is still a significant factor – about 6% of the overall cost in Kenya, and 5% in Uganda.
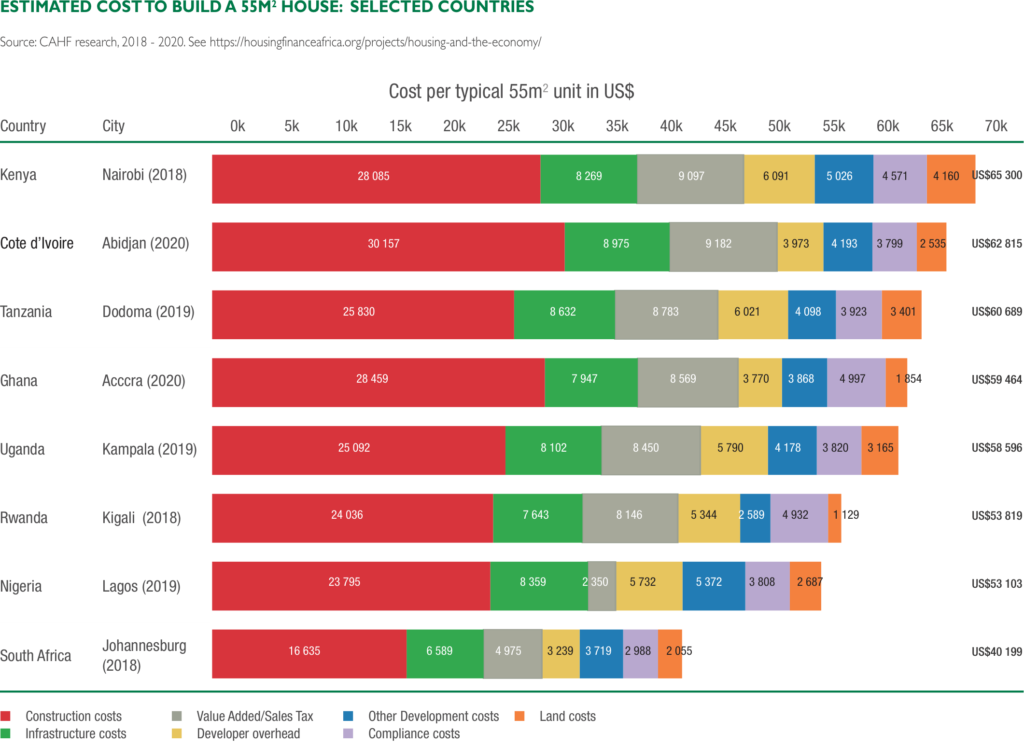
A significant driver of costs across all categories is the efficiency (or inefficiency) of statutory compliance processes – whether in terms of land titling, building plan approval, environmental impact assessments, etc. In Ghana, compliance costs comprised 8% of the overall price of the unit and represented the highest absolute value, closely followed by Rwanda, where compliance costs comprised 9% of the overall price of the unit. In all countries, value added tax plays a significant role in adding to the price of the unit – between 13-16%. While this is appropriate for a middle-income unit at the price range of these 55m2 houses, it would seem equally appropriate to waive or reduce this fee for units targeted at the very bottom end of what developers can feasibly build.
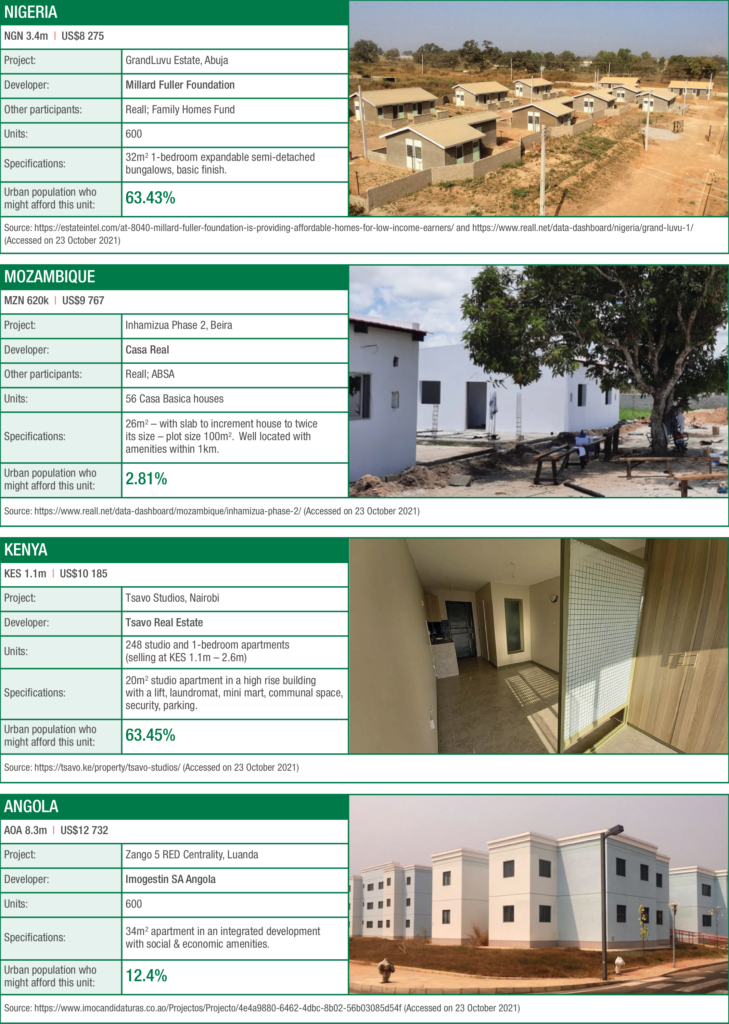
In 2021, the cheapest newly built house was again the house delivered by the Millard Fuller Foundation, now being sold by Family Homes Funds in a development of about 600 units just outside of Abuja. At NGN 3.4m (or about US$8 275) per unit, this house has set a new standard for affordable housing.[11] This year, there were more examples clustering around this price range. Two of these (the MFF house in Nigeria and a house delivered in Mozambique by Casa Real) were supported with capital from Reall, an impact investor targeting the delivery of affordable housing across Africa and Asia. The Kenyan example is built by a private developer, Tsavo Real Estate, and the Angolan developer, Imogestin SA is a private company that has been appointed by the Angolan government to drive the government’s housing projects. The units are small – between 20-34m2 – and save land costs by taking a denser settlement approach. It is likely that for many, there is some form of subsidy. All support a sustainable human settlements approach, prioritizing access to amenities along with the unit spec.
There are other examples: In Malawi, a MWK 10m unit (about US$12 468) was developed by a developer known as Sulsdec. In Rwanda, the Rwandan Housing Authority was delivering a RWF12.5m unit (about US$12 689). AGUIFIL, the state housing developer in Guinea delivered a GNF132.5m unit (about US$13 469)[12], while OPES Holding in Côte d’Ivoire delivered a XOF 8.5m (about US$15 364) unit. More are coming: while the cheapest house in Sierra Leone was recorded this year as costing about US$20 469, Jobomax has announced that it will start delivering a US$10 000 house in a new project in Freetown.[13]
In 2021 it feels like more developers are recognizing the affordability imperative and meeting this with well-priced housing, targeted at the bottom end of what can be delivered. And yet, this effort is no more than a drop in the ocean of what is needed to even begin to meet the potential demand. Few developers have the capacity to deliver more than a few hundred units at a time. In Kenya, a country where the government is actively supporting the delivery of affordable housing, the national statistical bureau reports that only 12 332 houses were completed in 2019[14], in contrast with the estimated 200 000 units required annually to address the backlog and accommodate new family formation. While the Rwandan government’s Integrated Development Programme – arguably the most successful large scale development programme in the country – has delivered 28 000 units, this was over 10 years; much slower than the country’s Vision 2050 anticipates is necessary. Shelter Afrique, the Pan African body with 44 African governments as its shareholders, financed the delivery of only 5 101 housing units in 2020. In June 2021, Pan African developer TAF Africa Global announced a one million house promise – the delivery of 50 000 units per annum for the next 20 years between now and 2040.[15] In partnership with Shelter Afrique, this would certainly change the face of affordable housing delivery on the continent. And still, from a continental perspective, it is not enough.
Scale will require new players: new developers and contractors, new investors, and new financiers. Bringing them in will require a good story, a strong motivation demonstrating and quantifying the market opportunity and concomitant risk. Notwithstanding the evolving track record, this is hard to come by, and investors and developers highlight the difficulty of accessing data that gives an accurate picture of the affordable housing investment opportunity. In part, this is because they themselves don’t share the data that they collect. Key data questions relate to the nature of the product, its composition and associated costs; the housing delivery process followed, including steps, time and cost; the blockages that arise and the implications these have on overall affordability; details relating to people, the target market, their affordability, other financial pressures, housing needs; and then the performance of the investment, whether this is a worthwhile venture, how it might be improved, and so on. This detail remains elusive, locked in the quarterly funding reports that developers submit to their funders and invisible to everyone else. As a result, investors and other market players are reticent to engage because they can’t quantify what that would involve.
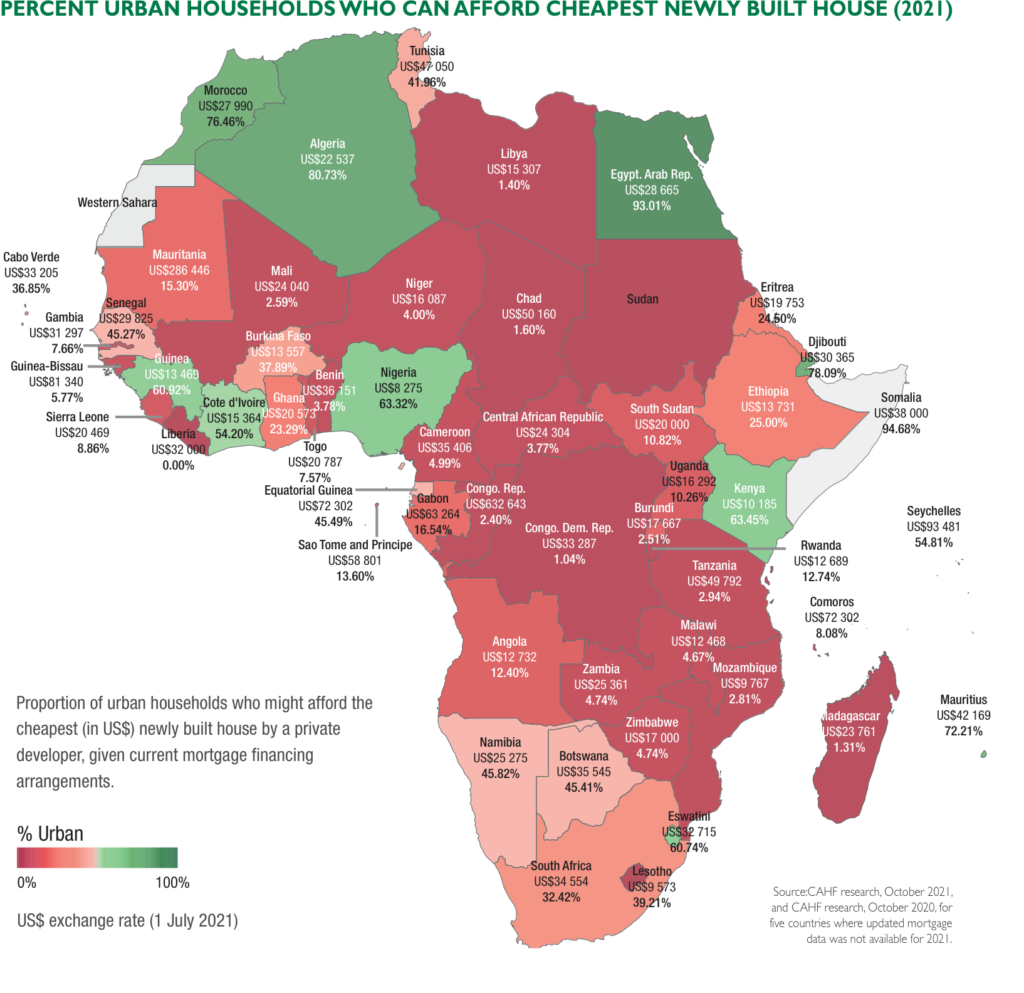
Even with a focus on lower cost housing, the housing affordability picture remains bleak. In only twelve countries can more than half of the urban population afford to buy the cheapest newly built house this year. Among these are Nigeria and Kenya, where an estimated 63% of the urban population in each country can afford to buy the cheapest house, and Côte d’Ivoire, where about 54% can afford to buy the US$15 364 unit. Casa Real’s US$9767 house in Mozambique is only affordable to about 2.81% of the urban population, however. And the US$12 732 unit in Angola is affordable to only about 12.4% of the urban population in that country.
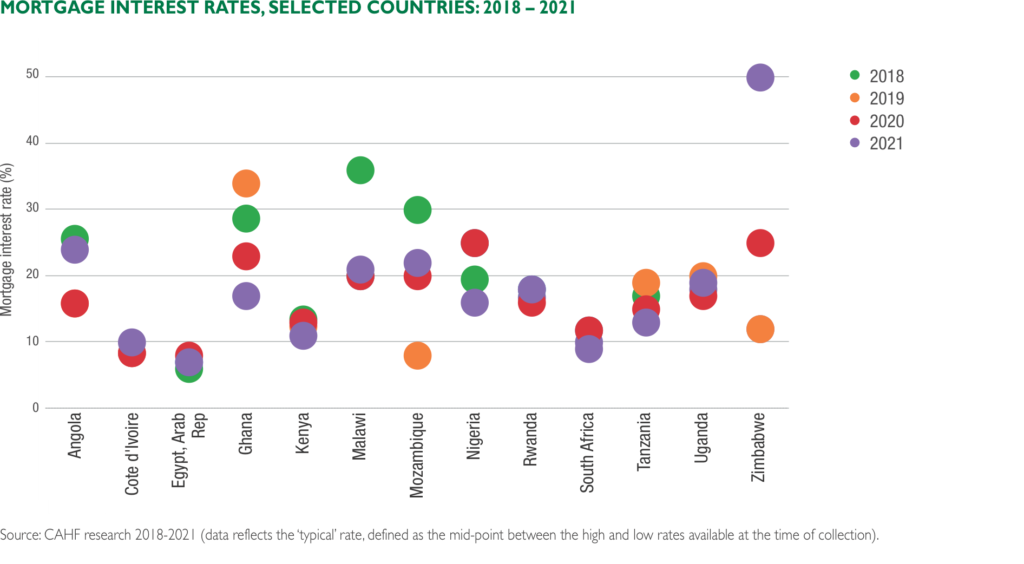
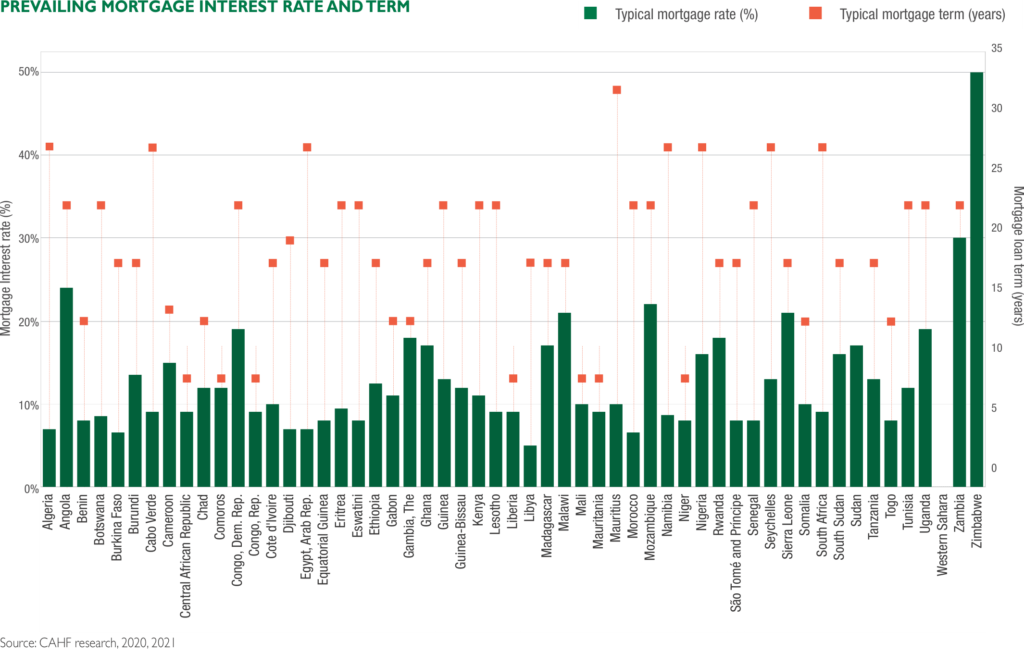
What this points to, therefore, is that house price is not the only factor contributing to affordability. Another factor is the cost and structure of the available finance. Interest rates remain high across the continent, often more than 10% and in some cases as high as 20% (in 2021, sixteen countries had mortgage interest rates above 15%, compared with twenty countries in 2020). The highest mortgage interest rate this year was found in Zimbabwe – 54%, as offered by CBZ Bank over a maximum period of 12 months.[16] Zimbabwe is a sobering example of the impact that macro-economic factors have on the cost of borrowing; with an inflation rate of 50.2% in August 2021 (this being the lowest since 2018) and a 40% overnight lending rate set by the Reserve Bank of Zimbabwe[17], mortgage lending is virtually impossible.
One measure that central banks adopted to address the economic impact of the COVID-19 pandemic, was a reduction in interest rates. In several countries, the prevailing mortgage rate in 2020 was lower than in previous years – South Africa’s prime rate of 7% in 2020 was the lowest that country had seen in forty years. 2021 saw a slight increase in some countries – in many however, interest rates are still lower than before the pandemic. The mortgage rates in Kenya, Tanzania, Nigeria and Egypt reflect the impact of the mortgage liquidity facilities established in those countries.[18] Rwanda’s rate is expected to come down to 11% in late 2021 or 2022, with support from the World Bank and the possible establishment of a mortgage refinance company in that country.
Source: CAHF research 2018-2021 (data reflects the ‘typical’ rate, defined as the mid-point between the high and low rates available at the time of collection).
The third factor impacting on affordability is, of course, household incomes and expenditure, both of which shape the amount that a household can dedicate to the repayment of their loans, and access to finance given such repayment capacity. Income is notoriously difficult to determine – aside from the fact that accurate data is simply not available, the proportion of employed people who earn their income informally, without documented evidence, is significant. A better measure of affordability, therefore, is consumption. CAHF’s purchase of GIDD data from the Economist Intelligence Unit is based on consumption, in purchasing power parity dollars (PPP$). Indicative, it offers only a rough picture of income distribution across the continent.
We know a little bit about what people spend. Income and expenditure surveys across the continent measure the distribution of expenditure across various categories. In Rwanda, for example, we can see that urban renter households apply about 15% of their total expenditure to rent. Rural renter households apply about 8% of total expenditure to rent. By contrast, about 40% of monthly expenditure among urban Rwandans is spent on food and another 10% on transport.[19] This is important information, because it suggests that it is unlikely that households can afford to allocate 30% of their incomes to housing. In a forthcoming paper prepared for the World Bank, Nohn et al argue that households in lower income deciles spend far less than the benchmark “30%” applied to mortgage affordability calculations.[20] A 2014 paper by Lozano-Gracia and Young also makes this point, showing that the poorest quintile in Africa spends 60% on food, with only about 12% spent on housing and utilities. As income increases, the percentage expenditure on food decreases, but transport costs rise. Housing expenditure for the top quintile, however, was still found to be only about 12% of total expenditure.[21] The consequence of applying this observation to mortgage affordability is significant. In Rwanda, for example, anticipating the 11% mortgage promised by the Rwanda Housing Finance Programme, the cheapest newly built house of RWF 12.5m would be affordable to 13.6% of urban households at 30% instalment to income (about 71 403 households), but only 3.6% of urban households at 15% instalment to income (about 19 033 households).[22]
A further challenge relates to financial access. Typical mortgage eligibility requirements include formal employment demonstrated with pay slips. This necessarily excludes a significant segment of the workforce that is not salaried – the self-employed, farmers, and informally employed. In the Central African Republic, the informal sector is the largest employer. In Rwanda, out of 6.76 million adults, only a third (2.14 million) are salaried workers. A further 520 395 are self-employed and another 1.6m are independent farmers. Finscope Rwanda 2020 finds that the majority of Rwandan homeowners in both urban and rural areas financed their homes using savings. Only about a fifth of urban homeowners (19% of those who built their own housing and 22% of those who bought) used a bank loan to pay for their homes.[23] (This, of course, also has an impact on market target. In Kenya, for example, it has been observed that cash buyers of entry-level units are likely to be investors, rather than buyers of their own home. While the use of the dwelling once bought may not be of concern to the developer, the sale of affordably targeted units to investors who then rent them out to higher income earners defeats the affordable housing delivery objective.)
So, while developers are increasingly recognizing the need to make more affordable housing, the scale at which they’re delivering is insufficient to meet the potential scale of demand. At the same time, the capacity of the demand to access supply is curtailed – finance is expensive, and often inaccessible to the lower income earners at whom affordable housing is targeted, given the informal nature of their employment. Meanwhile, the capacity of the state to step in and fix it, providing land, infrastructure, or other subsidies to assist households overcome affordability constraints, or expediting development processes to enable housing investment, is more constrained than it ever has been.
This picture is common across the continent, and well understood among housing sector practitioners. The disconnect is that national housing visions and the policies they inspire persist on asserting a developer-driven, whole house construction approach financed with mortgages. In virtually every country, the true business of housing is quite different from what the policies, administrative systems and statutory frameworks define. The majority of housing is built by households themselves, incrementally, step-by-step with savings, by micro builders operating on the instruction of homeowners, or by small-scale, often informal sector builders building five or ten units at a time. In Tanzania, it is estimated that only 41% of employment in construction is with the private sector. The informal sector, on the other hand, employs about 56% of all construction labour in the country. In Côte d’Ivoire, most housing construction is a result of informal sector activity.[24] The Ugandan Bureau of Statistics estimated that informal activity contributed 24% to the GDP of the construction sector in 2018.[25]
While these smaller scale, informal sector players are particularly important, their action is below the radar, and therefore overlooked not only by policy, but also by finance. Small scale and micro developers with the capacity to build anywhere between 2-20, or even up to 100 dwellings per annum struggle to raise capital. Operating informally, they often skirt building standards and bylaws. While this allows them to deliver more cheaply, it also makes them ineligible for formal finance, and may also put consumers at risk. They rely on buyer deposits as construction progress payments to finance their developments which necessarily puts a cap on the scale at which they are able to build. On their own, their delivery is unremarkable. Added up together, these are the builders of Africa.
2021: Recovery through recognition of massive small potential
As the world emerges from the pandemic, the question of economic recovery is paramount. This is the focus of this year’s African Economic Outlook, which considers the post-COVID 19 recovery imperative as a progression from debt resolution to growth. Assessing the continent’s potential, the AfDB projects 3.4% growth in real GDP overall in 2021 – with recovery strongest in tourism-dependent countries (6.2% growth projected for 2021 versus a contraction of 11.5% in 2020), and non-resource intensive economies (4.1% growth in 2021 versus a 0.9% contraction in 2020). While oil-exporting and other resource-intensive economies contracted by 1.5% and 4.6% in 2020 respectively, these are expected to grow by 3.1% in 2021.[26]
These movements anticipate a resumption of activity in the typical sectors that drive our economies. But they overlook the particular opportunity that a renewed focus on the housing sector offers us. There are four components to this vision: target, supply, finance, and data.
First, we need to shift our target. We need to recognize that the demand for affordable housing is a demand for a much lower cost unit than is currently the norm. While a US$20 000 unit may be ‘affordable’ in comparative terms, there are only a very few countries where this is affordable to the majority. Setting the benchmark around US$10 000 is more realistic. This is achievable – this year we are already seen the delivery of housing units costing less than US$15 000. While developers realise this price through a combination of factors (very small sizes, limited finishes, some subsidization), their delivery demonstrates that this is possible, and over time, lessons in efficiency will improve the output, especially if we document the process and share the data. Just doing a back-of-the-envelope calculation: if we take the GIDD income distribution as set out on the following pages and consider the proportion of households, roughly, who could afford more than US$8000 but less than US$15 000 with current financing (say, an average unit price of US$11 500), we come to about 18 million units. Delivered over ten years, this would imply a continental rate of delivery of about 1.8 million units per year. The total value of annual delivery therefore would be about US$20.7 billion. Drawing on assumptions developed through CAHF’s research into the housing economic value chain[27], we can very roughly calculate the following:
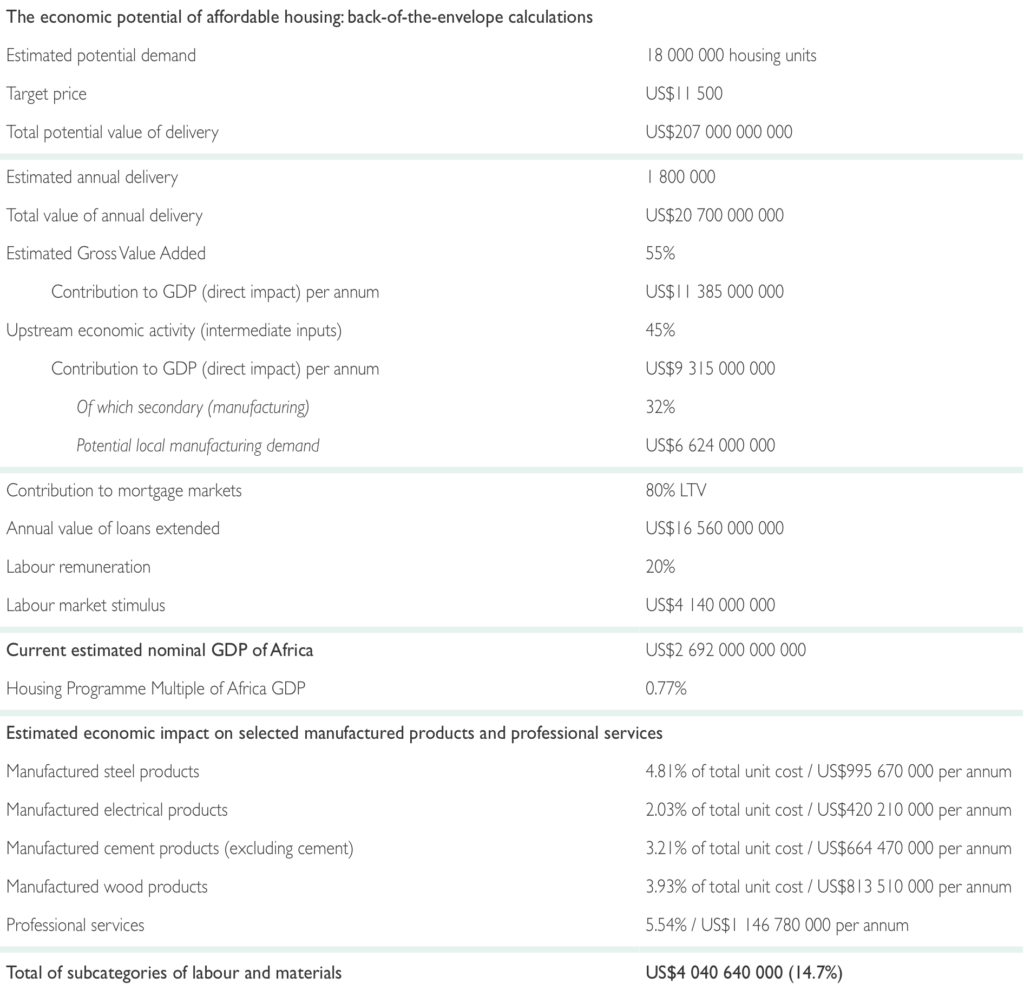
What does this mean? By targeting the delivery of very affordable housing units at the market that would be able to afford them, and by ensuring the availability of appropriate and adequate finance, we could stimulate US$20.7 billion of economic activity across the continent, annually. About one third of this would likely come from the manufacturing sector – a total of US$6.6 billion. The effort is likely to generate about US$4 billion of labour market activity, whether in the formal or informal sector, and a further US$4 billion in labour and materials. Of course, this activity would then further stimulate other activity up and down stream. This is not to say that houses in the range of US$20 000 – US$40 000 are not needed – they also target an important, albeit much smaller market segment.
Second, we need to think more broadly about the nature of supply, and then support this diversity in each of its submarkets. The delivery of this many units would require much more delivery capacity, well beyond the cohort of formal developers that are currently understood to underpin the sector. Policy makers and the private sector need to recognise small scale providers – small scale developers, micro builders, and households – as key suppliers of housing in addition to the more obviously recognized developer sector. To date, operational inefficiencies and barriers for entry have relegated much of this small scale activity to the informal sector. This undermines both the quality and scale at which small scale players can deliver and limits their access to finance, having knock-on effects on their low income consumers. Policy should explicitly embrace the capacity of these smaller scale players – and recognise the massive potential of their collective effort.
Governments can be encouraged by the flexibility of the private sector. Across the continent, private sector practitioners are building track records, operating across the entire value chain, or in specific niche markets, providing goods and services to a wide breadth of households. Their ability to operate is fundamentally influenced by their awareness of the market – the demand for their products and services – and the risks associated with specific sub-segments. This means that private sector interest in engaging can be influenced by the information that is available to quantify the opportunity and clarify the risk. In many instances, access to data and functioning, smooth statutory processes, will be significantly more valuable to private sector players than actual subsidies.
Third, we need to think about finance with much greater reference to its target, designing products and services that meet and support the delivery capacity and needs of households as well as small scale suppliers. The mortgages for this target will be small – much smaller than is likely comfortable for lenders, in some cases closer to the notion of a ‘micro’ mortgage. Lenders can leverage technology to achieve the economies of scale necessary to make the business case –this is entirely possible in the current environment. Lenders also need to recognize that their borrowers will likely not have pay slips. Again, technology offers interesting opportunities for alternative credit scoring and underwriting practices. And if they wish to engage constructively with the small scale and micro developer sector, lenders will need to understand businesses in various stages of development, tailoring the products they offer to meet the capacity of the client. The lack of construction finance for the supplier submarkets that explicitly target lower income households results in haphazard and constrained housing delivery. The provision of finance in this underserved and diverse space therefore has the potential to fundamentally transform and leverage this energy, creating a massive effort out of multiple, small initiatives creating a whole that is greater than the sum of its parts.
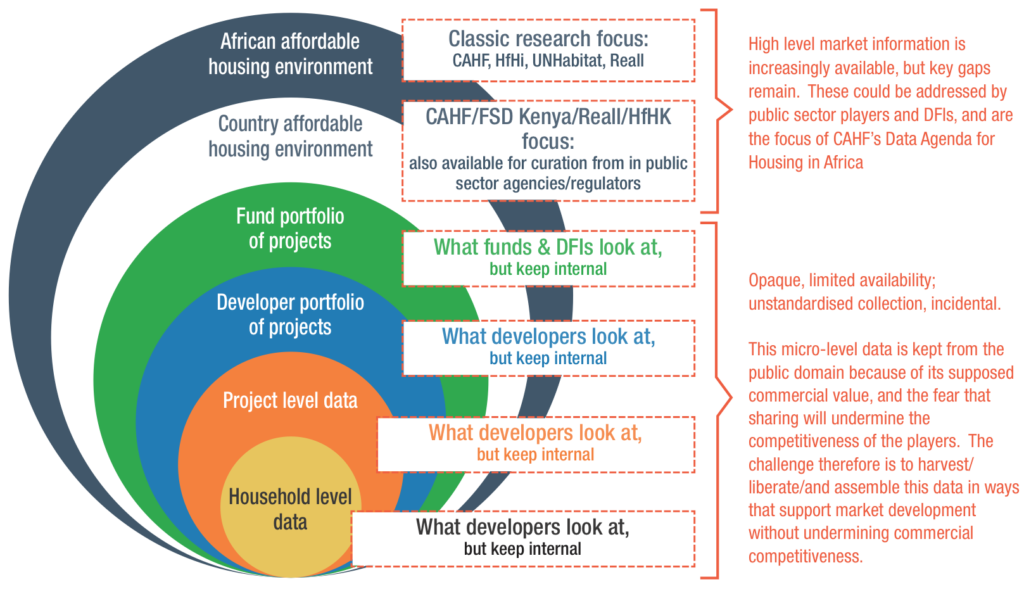
The fourth component, the data, is fundamental market infrastructure. A key constraint undermining private sector participation and good policy engagement in affordable housing and its financing is the availability of data and market intelligence to facilitate risk taking and decision making. In providing market intelligence that makes the case for investment in underserved markets (segmenting and quantifying the demand side; and scoping, understanding and tracking the supply side), we can support a better policy environment and increased private sector activity in affordable housing markets, catalysing scale interventions.
Ironically, the best source for nuanced, project-level data is the project itself. From the first concept note to the market feasibility study, to the due diligence undertaken on the funding proposal, important information is collected and presented to promote the project. Once underway, the delivery experience in each link in the housing value chain produces further data that can offer insights into the efficiencies and challenges that support or undermine the delivery of affordable housing. How the project is then received by the target market, and key features of that target, is similarly useful in understanding the breadth and character of demand.
All of this data is valuable. It clarifies the nature of the effort, creating a basis for evaluating outcomes. It highlights blockages in the value chain for attention by policy makers, or possibly for the creation of innovative work-arounds by other market players or government officials. It demonstrates particular market opportunities and suggests points of emphasis. And in these ways (and overall), it can be used to reduce risk as the stakeholders to an initiative have more and better information about what might be involved, enabling them to plan and better target their offerings. This improves the efficiency of investment while also lowering barriers to entry by other parties, who then see opportunities to engage in affordable housing. All of this together creates the basis for scale, even beyond the capital associated with the actual investment.
While the COVID19 pandemic has magnified the housing challenges facing a large majority of households living across this continent, the actual efforts of developers, small scale providers and households themselves has highlighted the opportunity for a new approach. The context calls for creativity and pragmatism as all grapple with the need to do more with less. Towards this imperative, data and information sharing between the parties, and collaboration in the advocacy and engagement processes, will leverage the individual efforts of the parties to realise economies of scale across their efforts. This is the power of massive small.
[1] Several people have been talking about the need to shift our understanding of affordable housing from an emphasis on large scale, massive projects, to a recognition of, and support for, the massive potential of very many small-scale housing suppliers, all driving their own projects. Among these has been Matthew Nell, a visionary affordable housing practitioner based in South Africa. Matthew Nell passed away in September 2021. The ideas in this essay are presented with gratitude for the very many conversations we had over 29 years and are dedicated to Matthew in his memory. For Matthew’s recent thinking on the subject, see https://www.cde.org.za/we-need-a-radical-rethink-on-housing-and-urban-development/ (Accessed 23 October 2021).
[2] African Development Bank (2021). African Economic Outlook 2021: From Debt Resolution to Growth: The Road Ahead for Africa. https://www.afdb.org/en/documents/african-economic-outlook-2021 (Accessed 21 October 2021).
[3] African Development Bank (2021). African Economic Outlook 2021: From Debt Resolution to Growth: The Road Ahead for Africa. https://www.afdb.org/en/documents/african-economic-outlook-2021 (Accessed 21 October 2021). Pgs. 23-24.
[4] DRC profile, citing World Bank (2018). Democratic Republic of Congo Urbanization Review: Productive and Inclusive Cities for an Emerging Democratic Republic of Congo. https://openknowledge.worldbank.org/bitstream/handle/10986/28931/9781464812033.pdf?sequence=2&isAllow (Accessed 13 September 2021). Pg. 1.
[5] DRC profile, citing Investors Clubs (2021). Housing sector in DR Congo https://investorsclubs.org/housing-sector-in-dr-congo/ (Accessed 4 August 2021).
[6] For example, the Daily Maverick reports that South Africa’s excess death toll is three times that of deaths caused by COVID-19. See https://www.dailymaverick.co.za/article/2021-10-20-264809-deaths-later-covid-19s-terrifying-toll-on-south-africa-almost-three-times-the-official-figure/ (Accessed 23 October 2021).
[7] Tracking COVID-19 excess deaths across countries (updated on October 20th) The Economist. See https://www.economist.com/graphic-detail/coronavirus-excess-deaths-tracker (Accessed 23 October 2021).
[8] African Development Bank (2021). African Economic Outlook 2021: From Debt Resolution to Growth: The Road Ahead for Africa. https://www.afdb.org/en/documents/african-economic-outlook-2021 (Accessed 21 October 2021). Pg. 45.
[9] Explore the B40 Dashboard here: https://housingfinanceafrica.org/documents/b40-dashboard/
[10] See https://www.dhsprogram.com/ (Accessed 24 October 2021).
[11] https://estateintel.com/at-8040-millard-fuller-foundation-is-providing-affordable-homes-for-low-income-earners/ and https://www.reall.net/data-dashboard/nigeria/grand-luvu-1/ (Accessed 23 October 2021).
[12] See https://www.aguifil.gov.gn/tous-nos-projets/ (Accessed 23 October 2021).
[13] See https://www.prnewswire.com/news-releases/jobomax-launches-new-housing-model-with-prices-starting-at-10-000–301349544.html (Accessed 23 October 2021).
[14] This data was collected as part of the Data Landscape Review of Kenya, undertaken by CAHF in cooperation with Reall and 71point4. The data is showcased on Reall’s website https://www.reall.net/msi/kenya/ and is available from the KNBS’ Economic Survey 2020 https://s3-eu-west-1.amazonaws.com/s3.sourceafrica.net/documents/119905/KNBS-Economic-Survey-2020.pdf (Accessed 24 October 2021).
[15] Tine, Adama (2021). Sierra Leone: TAF Targets to Build 1m Homes in Africa by 2040. 11 June 2021, The Point (Banjul) https://allafrica.com/stories/202106140909.html (Accessed 24 October 2021).
[16] See https://www.cbz.co.zw/borrowing/private-mortgage-finance/ (Accessed 24 October 2021).
[17] See https://tradingeconomics.com/zimbabwe/interest-rate#:~:text=Interest%20Rate%20in%20Zimbabwe%20averaged,percent%20in%20March%20of%202019 (Accessed 24 October 2021).
[18] See the Kenya Mortgage Refinance Company (www.kmrc.co.ke), the Tanzania Mortgage Refinance Company (www.tmrc.co.tz), the Nigeria Mortgage Refinance Company (www.nmrc.com.ng), the Egypt Mortgage Refinance Company (www.emrc-online.com), and also the Caisse Régionale de Refinancement Hypothécaire (CRRH – www.crrhuemoa.org) that serves the West African region. (All accessed 24 October 2021)
[19] NISR. (2017). Integrated Household Living Conditions Survey 5 (EICV 5). https://www.statistics.gov.rw/datasource/integrated-household-living-conditions-survey-5-eicv-5. Analysis by 71point4 for Access to Finance Rwanda.
[20] Nohn, M., Rajashekar, A. et al (2021 forthcoming). “The Myth of the 30%.” World Bank.
[21] Lozano-Gracia, N. and Young, C. (2014). Housing Consumption and Urbanisation. World Bank Group: Social, Urban, Rural and Resilience Global Practice Group. Pgs. 4-5. http://documents1.worldbank.org/curated/en/998081468003944551/pdf/WPS7112.pdf (Accessed 23 October 2021).
[22] Analysis by 71point4 using the Fifth Integrated Household Living Survey (EICV 5) for Rwanda (2016/17). Expenditure data was used to estimate household income, inflated to 2021. See https://www.statistics.gov.rw/publication/eicv-5-main-indicators-report-201617 for the Main Indicators Report.
[23] Access to Finance Rwanda (2021). Scoping Rwanda’s Affordable Housing Sector and its Financing. Prepared for AfR by the Centre for Affordable Housing Finance in Africa, 71point4, Dieye, F and Mwango, B A. September 2021. Unpublished at the time of printing – see www.afr.rw for details.
[24] See https://housingfinanceafrica.org/documents/the-housing-economic-value-chain-the-case-of-cote-divoire/ (Accessed 1 August 2021).
[25] See https://housingfinanceafrica.org/documents/ugandas-housing-construction-and-housing-rental-activities-housing-economic-value-chain-and-housing-cost-benchmarking-analysis/ (Accessed 1 August 2021).
[26] African Development Bank (2021). African Economic Outlook 2021: From Debt Resolution to Growth: The Road Ahead for Africa. https://www.afdb.org/en/documents/african-economic-outlook-2021 (Accessed 21 October 2021). Pg. 1.
[27] CAHF has undertaken Housing Economic Value Chain studies in South Africa, Kenya, Rwanda, Nigeria, Uganda, Tanzania, Ghana, and Côte d’Ivoire. A study on Senegal is currently underway. David Gardner, Keith Lockwood and Jacus Pienaar are the authors of the work. Many thanks to David Gardner for these back of the envelope calculations.